You are incorrect - the best interpretation of the electrocardiogram in our patient is left ventricular hypertrophy and left atrial enlargement.
Click on the links to learn about this ECG:
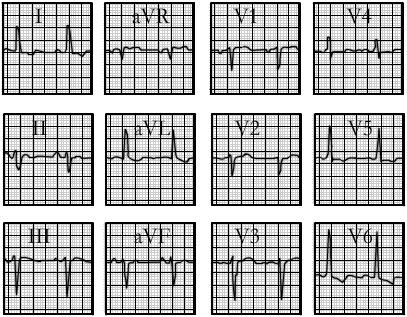
Your choice: Left ventricular hypertrophy + left anterior fascicular block
This electrocardiogram shows left ventricular hypertrophy and left anterior fascicular block. The characteristic features of left ventricular hypertrophy demonstrated here include increased voltage, reflected by the tall R wave in aVL exceeding 11 mm, ST-T abnormalities well seen in this lead as well as leads I, V5 and V6, a prolongation of the QRS interval, and left atrial enlargement, reflected by the wide P wave in lead II and the prominent negative P wave in lead V1. Left anterior fascicular block is manifested by left axis deviation of ≥ -45° and is reflected by the negative QRS in lead II with an rS morphology in lead II.