You are incorrect - the best interpretation of the electrocardiogram in our patient is right ventricular hypertrophy and right axis deviation.
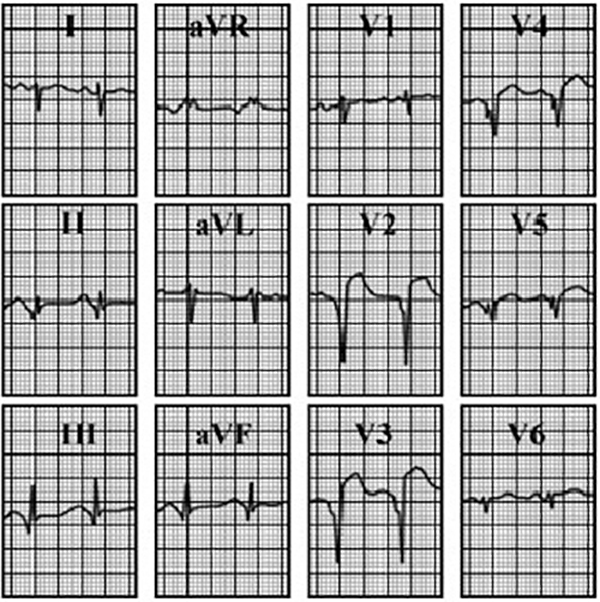
This electrocardiogram shows left posterior fascicular block. The characteristic feature demonstrated here is an axis greater than +90° in the absence of evidence of right ventricular hypertrophy. This right axis deviation is reflected in part by the predominantly negative QRS complex in lead I. In this electrocardiogram, there is evidence of an old inferior wall myocardial infarction, demonstrated by the pathologic Q waves in leads II, III and aVF; and either an acute anterior wall myocardial infarction or an old anterior wall myocardial infarction with aneurysm formation, demonstrated by the pathologic Q waves and ST segment elevation in leads V2 to V5. These changes further support the diagnosis of left posterior fascicular block due to at least 2-vessel coronary artery disease.