You are incorrect - the best interpretation of the electrocardiogram in our patient is acute anterior wall myocardial infarction with complete right bundle branch block.
Your choice: Myocardial ischemia
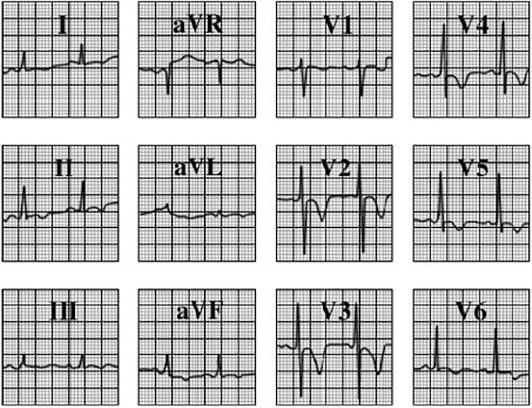
This electrocardiogram shows myocardial ischemia. The characteristic feature demonstrated here is most marked in the precordial leads, specifically the deep, symmetric T wave inversion seen especially in leads V2 through V5. Ischemic T wave changes are often transient. If they persist, they may be the result of prolonged ischemia, as may be seen with unstable angina or non-ST elevation myocardial infarction. Enzyme studies would be necessary to differentiate between these two possibilities.