You are incorrect - the best interpretation of the electrocardiogram in our patient is non-specific intraventricular conduction delay.
Click on the links to learn about this ECG:
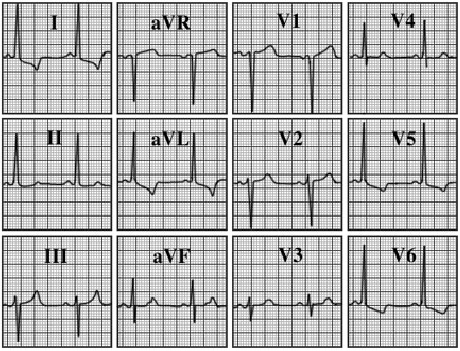
Your choice: Left ventricular hypertrophy
This electrocardiogram shows left ventricular hypertrophy. The characteristic features demonstrated here include increased voltage reflected by the S wave in V1, the R wave in V5 exceeding 35 mm. Associated tall R waves in leads I, aVL. V5 and V6 and ST-T wave abnormalities is well seen in these leads.